Know Your Indicators
Technical indicators are data driven tools that traders use to analyze market behavior and make better decisions. They’re built on price, volume, and sometimes time giving hints about what might happen next. In fast moving crypto markets, these indicators aren’t just helpful they’re mission critical.
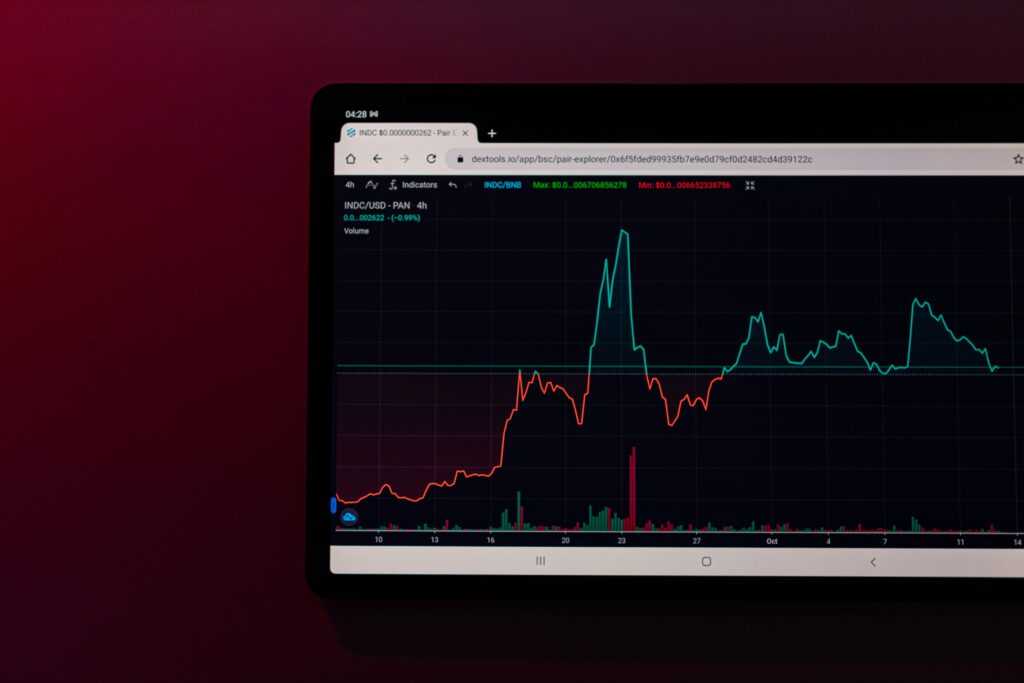
Why? Volatility. Crypto doesn’t trade like traditional financial assets. It moves faster, reacts sharper, and breaks patterns more often. A tweet, a policy change, or a big whale transfer can shift the entire playing field in minutes. That’s where indicators come in. They help you stay level headed when everything else is chaos, offering real time signals to enter, exit, or hold your position.
Volume spikes, moving averages, momentum oscillators they’re all proxies for behavior. Not future tellers, but guides. The key is speed: indicators help you make split second decisions with some logic behind the trigger, instead of pure instinct or FOMO. They’re not magic, but in crypto trading, using them well is as close as you’ll get.
The Essentials: Core Indicators That Work
To succeed in crypto day trading, technical indicators are your navigation tools. While no single indicator can guarantee a profitable trade, understanding and effectively applying key indicators can help you make smarter, faster decisions.
Moving Averages (MA & EMA)
Moving averages are among the most commonly used indicators to spot trends in price movements.
Simple Moving Average (SMA): Smooths out price action over a fixed period. Best for identifying long term direction.
Exponential Moving Average (EMA): Puts more weight on recent prices, making it more responsive to current conditions.
When to Use EMAs vs. SMAs:
Use EMAs in dynamic markets where speed and reaction time are critical.
Use SMAs to filter out noise and understand broader trend direction.
What to Watch:
Price crossing above or below the MA/EMA can signal emerging trends.
The 50 day and 200 day moving averages are commonly used to gauge longer term momentum.
Relative Strength Index (RSI)
The RSI measures the strength of price movements on a scale from 0 to 100, helping traders gauge whether a coin is overbought or oversold.
Overbought: RSI above 70 price may be due for a pullback.
Oversold: RSI below 30 possible buy opportunity if buyers regain control.
Crypto Specific Tip: Due to high volatility, RSI thresholds may be adjusted (e.g., 80/20) for more accurate crypto trading signals.
Best Uses for RSI:
Confirming entry or exit points
Divergence analysis: price making higher highs while RSI makes lower highs (bearish signal), and vice versa
MACD (Moving Average Convergence Divergence)
MACD is a trend following momentum indicator that shows the relationship between two moving averages of a security’s price.
Key Components:
MACD Line = 12 day EMA 26 day EMA
Signal Line = 9 day EMA of the MACD Line
Histogram = MACD Line Signal Line
Common Signals:
Bullish Crossover: MACD line crosses above the signal line
Bearish Crossover: MACD line crosses below the signal line
Avoiding Noise in Crypto:
Use higher timeframes (1 hour or more) to reduce false signals
Combine MACD with RSI or volume indicators for extra confirmation
Bollinger Bands
Bollinger Bands consist of a middle band (usually a 20 day SMA) and two outer bands set two standard deviations apart. These help visualize price volatility and potential breakout zones.
How to Use Bollinger Bands:
Tight Bands: Low volatility prepare for a breakout
Wide Bands: High volatility expect price swings
Price touches upper band: Possible overbought condition
Price touches lower band: Potential oversold condition
Breakout Strategy:
Wait for squeeze (bands pinch together) followed by a sharp move
Confirm with volume surge to validate breakout direction
Pro Tip: Don’t trade based on band touches alone always combine with other indicators for confirmation.
When to Use What

Ask any seasoned crypto day trader and they’ll tell you: no single indicator wins every battle. The market changes shape too often. One day you’re in a clean uptrend, the next you’re chopping sideways in a rangebound mess. That’s why smart traders don’t bet on a lone signal they layer multiple tools to get clearer confirmation.
For example, you might use the RSI to catch momentum shifts, but pair it with moving averages to see the broader trend. If you’re getting mixed messages say, RSI shows overbought but price is breaking out of Bollinger Bands with strong volume you don’t rush in. You wait. Your edge comes from confirmation, not hope.
Also, match your tools to market behavior. Trending market? Moving averages and MACD are your friends. Flat, ranging conditions? Oscillators like RSI or Bollinger Bands work better. The goal isn’t just to stay active it’s to stay sharp.
Above all, don’t force it. No trade is better than a bad trade. Let the indicators speak, and only move when the story they tell makes sense. In crypto, patience isn’t just a virtue it’s a strategy.
Mistakes to Avoid
Too many beginners chase signals like they’re hunting treasure, bouncing from one flashing arrow to the next. The problem? No plan. No context. Just raw bias and hope. Technical indicators are tools not oracles. Without a strategy behind them, they’ll mislead you as fast as they flash green.
On top of that, cramming your screen with indicators might feel sophisticated, but it’s more like trading on noise. If you’ve got MACD, RSI, Bollinger Bands, Fibonacci levels, and volume screaming at once, good luck making a clear call. Pick two, maybe three. Get to know them deeply. Ignore the rest.
And don’t forget: technical setups mean nothing if a major news event knocks the market sideways. Fundamentals still punch through charts. If you’re staring at clean signals right as the Fed drops surprise rates or Binance halts withdrawals, your indicators won’t save you.
Keep it focused. Think in systems. Read the bigger picture. Check out these proven day trading strategies to stack with indicators.
Indicators Aren’t Crystal Balls
Indicators are tools not gospel. In crypto day trading, where volatility hits harder and faster than traditional markets, trusting a signal blindly can burn you. False breakouts, whipsaws, and bull or bear traps are part of the terrain. That’s why discipline beats hype. Stick to your plan. If the chart screams “buy” but your rules don’t align, hold your fire.
Discipline also grows from repetition. Spend time watching how indicators behave in different conditions. The more you study patterns without the pressure of real money the sharper your instincts get. It’s not magic, it’s reps. Use sandbox modes or paper trading to run drills. Get used to losing trades on paper before risking real capital.
Think of this as training season. Test combinations. Watch how indicators confirm or contradict each other. When you finally go live, you won’t flinch.
See more real world day trading strategies and tips to sidestep common errors
Final Takeaway
Indicators aren’t magic. They don’t predict the future they help you read what’s already happening. The best traders use them like a compass, not a crystal ball. You’re not trying to guess the next candle you’re trying to understand the story so far and react with discipline.
Keep it lean. Two or three solid indicators that you’ve mastered will beat a dashboard full of noise. Complexity isn’t strategy. It’s distraction.
Whatever tools you choose, stick to your method. That doesn’t mean being rigid. Adapt to the market but within a system you trust. If your setup works in trend conditions, don’t throw it out during a sideways chop. Refine, don’t chase.
Day trading crypto is fast and unforgiving. Indicators help, but your edge comes from clarity and consistency. Stay sharp. React smart. And when in doubt, sit it out.
 Head of Research & Blockchain Insights